This week we learned all about infographics and sketchnoting and its place in the education system. Both of these tools are beneficial for memorization as it allows for visual connections between the content. In my experience, I have always found that I learn best through my assignments rather than studying and memorizing solely notes from lectures. I honestly do the most of my learning through my own research. However, I have never thought to use sketchnoting or infographics for memorization purposes, I only had acquainted infographics with the classic poster board presentation. I believe that utilizing visual representations of one’s notes and learning would significantly increase their capability to memorize. In my Educational Psychology class, we are designated a discussion group for the semester. In that group, we go into depth about our learned topic of the day and have to create a visual representation of our learning. That image then gets added to our class discussion page that is utilized by everyone for studying purposes. I think this is a great way to incorporate infographics and sketchnoting in lessons!
In CopyPress’s article on The Benefits of Infographics for Education, they bring up a key component of using infographics to simplify complex topics. An editor at CopyPress contends “…infographics [may be] ideal for teaching the basics of complicated processes or breaking down high-level data for general audiences.” When one is faced with a limited word count or a specific amount of room to highlight your ideas, they must be able to pull out the key details of what is needed to be presented. By criticially analyzing information to draw out the significant components, they are doing so while actively memorizing. For a majority of us, we would best learn by memorizing a simple definition rather than a complex one. So, ultimately, infographics and sketchnoting are fantastic ways to segment, memorize, and understand concepts and should be utilized in education.
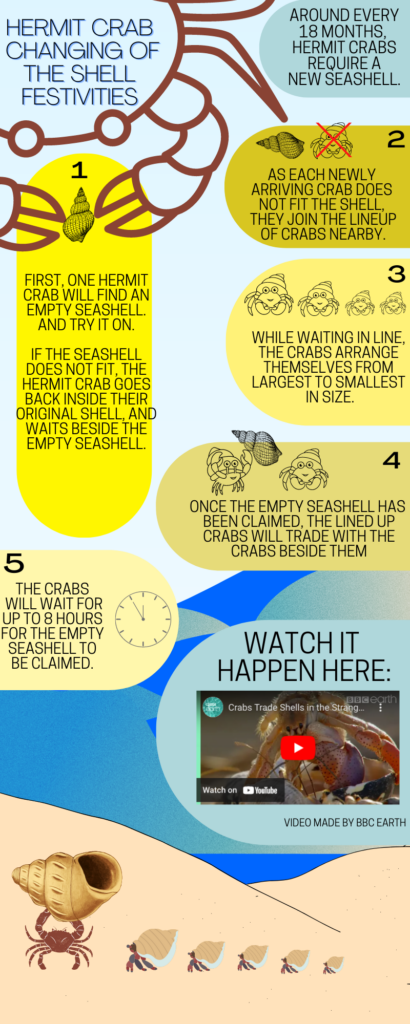
Infographic:
When contemplating what topic I should make my infographic about, the first thing I could think of was one of my favourite fun facts. I have fiddled around with Canva previously, but to no avail did anything come of it. I found that there were too many barriers that were put in place to market their premium version. However, despite my lack of reading instructions on how to use Canva, this time I found it extremely simple to create an infographic. I believe there are less restrictions for infographics than if you use their “docs” feature. I think Canva is a great tool, but more so if you’re willing to fork up $30 a month for premium. Instead, PowerPoint is a secret weapon. Many teachers have moved over to PowerPoint for making worksheets. All that you need to do is alter the slide size and you have complete freedom to move and add features as you require. PowerPoint also includes a great set of icons for free!
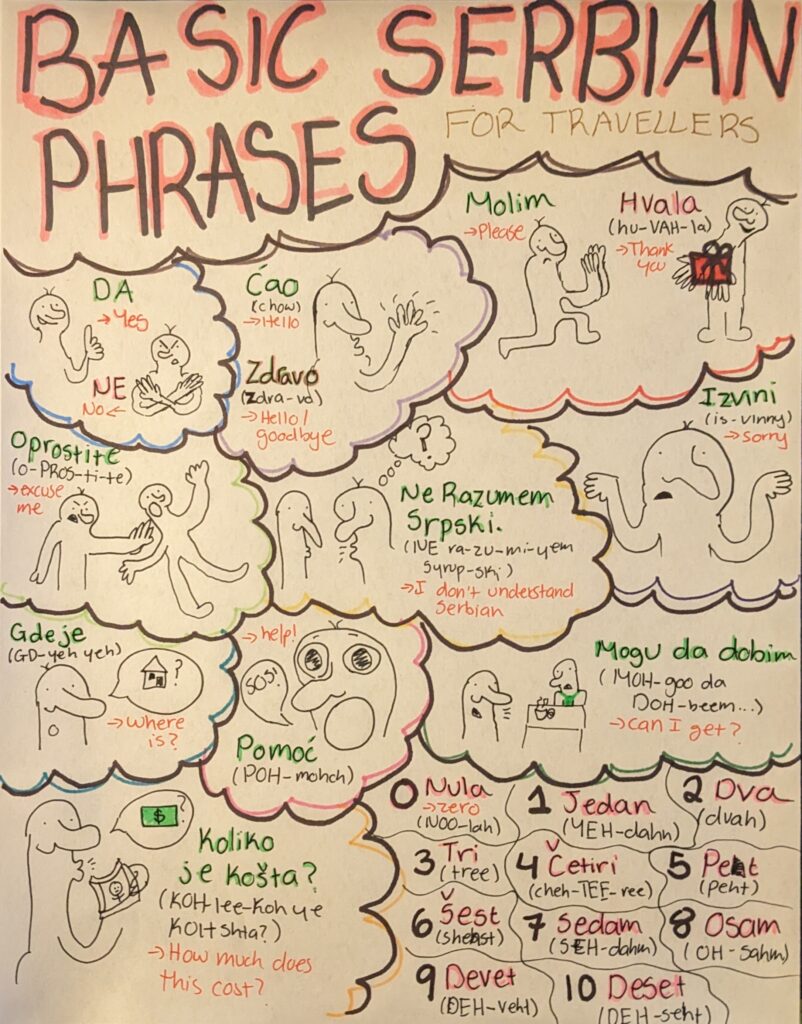
Sketchnoting:
Sketchnoting was a super fun activity to partake in. I have always been a terrible notetaker with illegible writing and unassociated doodles as a border; however, sketchnoting is a great tool to decrease writing, and make connections through doodling. I had a hard time deciding what topic to do my sketchnoting on as I was thinking more on the realms of “best Game of Thrones characters” but I don’t think that was necessarily an option. Instead, I decided to follow the route of sketchnoting for a foreign language. I wanted to be a bit more adventurous with my choice of language and opted to choose a country with many personal connections and one of my favourite travel destinations. As Serbian is pluricentric, you would be able to speak it in surrounding Balkan countries: Croatia, Bosnia and Herzegovina, and Montenegro.
16 February 2023 at 9:33 pm
I appreciated your reflection post on infographics and Sketchnoting. It was interesting to read your thoughts on these subjects. I would have to agree with you that most learning takes place when we are doing our assignments rather than memorizing facts. I look back at my own schooling and when I memorized the facts for a test, I lost that information. It never stuck with me but when I did assignments the information stayed in my long-term memory. I appreciated the article you included regarding infographics and how they are an ideal tool “for breaking down high-level data for general audiences” I loved your Infographic on Hermit Crabs. So adorable! I didn’t know that’s how they changed their shells. I have learned something new today through reading your blog so thank you! I know you’re an amazing artist, so I appreciated your sketchnote and thoughts on it. Well done!